2026 sector outlook: the macro forces that drive sector rotation
Interest rates, inflation, employment, consumer sentiment — these macro forces don't move individual stocks directly, but they shape which sectors thrive and which face headwinds. AlphaDrift tracks 8 universal economic indicators plus group-specific data from the Federal Reserve, then maps them to all 25 GICS Industry Groups through an AI-powered scenario analysis.
- AlphaDrift pulls 8 universal economic indicators from the Federal Reserve Economic Data (FRED) database — rates, inflation, employment, consumer sentiment, industrial production, yield curve, and oil — to assess structural conditions for every sector.
- The Macro Scenario Lens uses Claude Sonnet (Anthropic's reasoning AI model) to identify dominant economic themes, map two contrasting scenarios per theme, and deliver buy/caution/avoid verdicts across all 25 industry groups.
- These macro signals feed AlphaDrift's Opportunity Score — so every sector score is grounded in real economic data, not just price action or sentiment.
Why macro forces drive sector rotation
Sector rotation — the shifting of capital between industry groups as economic conditions change — is driven primarily by macro forces, not company-specific news. When the Federal Reserve raises interest rates, it doesn't matter how well a specific REIT manages its properties: the entire real estate sector faces higher borrowing costs and lower property valuations. When oil prices spike, every airline and trucking company pays more for fuel — no matter how efficient their operations.
Understanding which macro forces are in play — and which sectors they help or hurt — gives you a structural edge. Instead of reacting to yesterday's price moves, you can assess whether a sector's tailwinds or headwinds are likely to persist over the next 6–12 months.
AlphaDrift automates this analysis. It pulls economic data from the Federal Reserve's FRED database, tracks macro/policy news through Finnhub, and uses Claude Sonnet AI to map the current macro environment to sector-level outcomes. The result is a Macro Score for each of the 25 industry groups — a 6–12 month outlook that is completely independent of recent price action.
The 8 universal FRED economic indicators AlphaDrift tracks
AlphaDrift monitors eight FRED economic indicators that affect every industry group. Each is updated weekly and fed into the Structural Tailwinds component of the Macro Score (weighted 35% of the total). Here's what each measures and why it matters for sector analysis:
1. Federal Funds Rate (FEDFUNDS)
The overnight lending rate set by the Federal Reserve — the single most influential lever in monetary policy. When the Fed raises rates, borrowing costs rise across the economy. Rate-sensitive sectors (REITs, Utilities, Banks, Autos) feel the impact first. A rising rate environment compresses valuations for high-growth sectors reliant on future cash flows (Technology, Biotech), while favouring sectors with current earnings power (Energy, Insurance).
2. 10-Year Treasury Yield (DGS10)
The benchmark long-term interest rate, set by market participants rather than the Fed. It reflects expectations for growth and inflation over the next decade. A rising 10-Year yield makes dividend-paying sectors (Utilities, REITs, Consumer Staples) less attractive relative to bonds. It also raises the cost of capital for capital-intensive industries — construction, infrastructure, and real estate development.
3. Yield Curve Spread (T10Y2Y)
The difference between the 10-Year and 2-Year Treasury yields. A positive spread (normal curve) signals healthy growth expectations. A flat or inverted curve (negative spread) has historically preceded recessions. The yield curve is particularly important for Banks, whose net interest margins compress when the curve flattens — they borrow short and lend long, and a flat curve squeezes the spread.
4. WTI Crude Oil Price (DCOILWTICO)
West Texas Intermediate crude, the US oil price benchmark. Rising oil is a direct tailwind for the Energy sector and a headwind for Transportation (airlines, trucking, shipping), Consumer Discretionary (higher fuel costs reduce disposable income), and some Materials companies (petrochemical inputs). The impact is asymmetric — a $20 move from $60 to $80 per barrel hits airlines harder than a $20 move from $80 to $100, because margins are thinner at lower baseline levels.
5. University of Michigan Consumer Sentiment (UMCSENT)
A survey-based index measuring US consumer confidence about current finances and future expectations. Consumer sentiment is a leading indicator for discretionary spending — when consumers feel confident, they spend on travel, electronics, apparel, and dining out. When sentiment drops, they pull back to essentials. Directly relevant to Consumer Discretionary, Consumer Services, and Retail sectors.
6. Unemployment Rate (UNRATE)
The percentage of the labour force actively seeking work. Low unemployment supports consumer spending (more paychecks in the economy) but can create wage pressure that compresses corporate margins — especially in labour-intensive sectors like Retail, Hospitality, and Healthcare. Rising unemployment signals slowing demand, which tends to hit cyclical sectors (Capital Goods, Transportation, Autos) before defensive ones (Utilities, Staples, Healthcare).
7. Industrial Production Index (INDPRO)
A broad measure of output from manufacturing, mining, and utilities — published by the Federal Reserve. Year-over-year changes in industrial production signal the health of the goods-producing economy. Rising production is bullish for Capital Goods, Materials, and Semiconductors (which supply manufacturing). Declining production warns of an industrial slowdown, though it may not affect services-oriented sectors like Software or Financial Services.
8. Consumer Price Index — Inflation (CPIAUCSL)
The headline inflation measure, tracking the year-over-year change in prices paid by urban consumers. Moderate inflation (2–3%) is generally healthy. High inflation above 4% compresses consumer purchasing power and typically triggers Fed rate hikes — creating a cascading effect through rate-sensitive sectors. Some sectors benefit from inflation: Energy (commodity prices rise with inflation), Materials (pricing power), and companies with strong pricing power (Consumer Staples with brand loyalty).
Why FRED data? The Federal Reserve Economic Data database is maintained by the Federal Reserve Bank of St. Louis. It provides free, reliable, and well-documented economic time series used by institutional investors, central banks, and academic researchers worldwide. See the FRED API documentation.
Group-specific FRED indicators: tailored data for targeted sectors
Beyond the 8 universal indicators, AlphaDrift fetches additional FRED series for specific industry groups where a single data point is disproportionately informative. These supplements give the AI a clearer picture of sector-specific conditions:
- Semiconductors — Semiconductor production index. Tracks fab output and inventory cycles, relevant to ASML, TSMC, and their customers.
- Automobiles & Components — Total vehicle sales (SAAR). A leading demand signal for automakers, parts suppliers, and auto lenders.
- Utilities — Utilities production index. Measures electricity and gas output, reflecting both demand (weather, industrial activity) and capacity utilisation.
- Energy — Energy materials production index. Covers oil extraction, natural gas processing, and coal mining output.
- Materials — Metal ore mining production. Tracks output from iron ore, copper, and other mining operations — a direct signal for materials companies and their customers.
- Transportation — Airline revenue passenger miles. Measures actual air travel demand, relevant to airlines, airports, and travel services.
- Banks — Total commercial bank loans and leases. Tracks lending activity — the core of bank revenue. Rising loans signal credit expansion; declining loans warn of tightening.
- Consumer sectors — Personal consumption expenditure (PCE) and consumer sentiment together. PCE captures actual spending; sentiment captures future spending intentions.
Each of these indicators is fed to Claude Sonnet alongside the 8 universal series when scoring that group's structural outlook. Groups without a specific supplement (e.g., Insurance, Telecommunications) are scored using the universal indicators alone — which still capture the macro conditions that affect them.
The Macro Scenario Lens: AI-powered theme identification
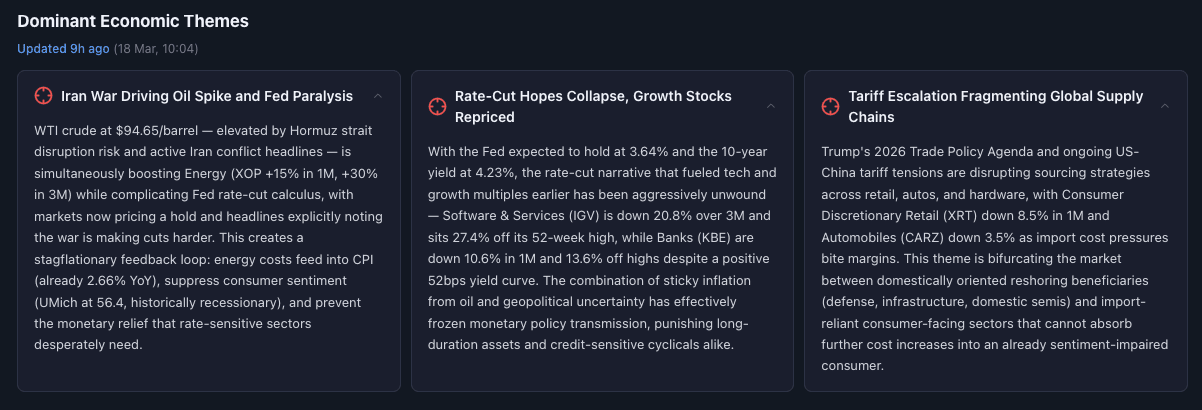
Individual macro indicators tell you what's happening in the economy. The Macro Scenario Lens — visible on the Opportunity page — goes one step further: it identifies why specific macro forces matter right now and which sectors will be affected.
The lens uses a two-stage Claude Sonnet AI pipeline:
Stage 1: Theme identification & scenario mapping
The AI receives the full data package — all 8 FRED indicators, the Fear & Greed score, macro/policy news headlines, and the current scores for all 25 industry groups (analyst consensus, structural, and sentiment). From this data, it identifies 2–3 dominant economic themes — the macro forces that are most likely to drive sector rotation in the current environment.
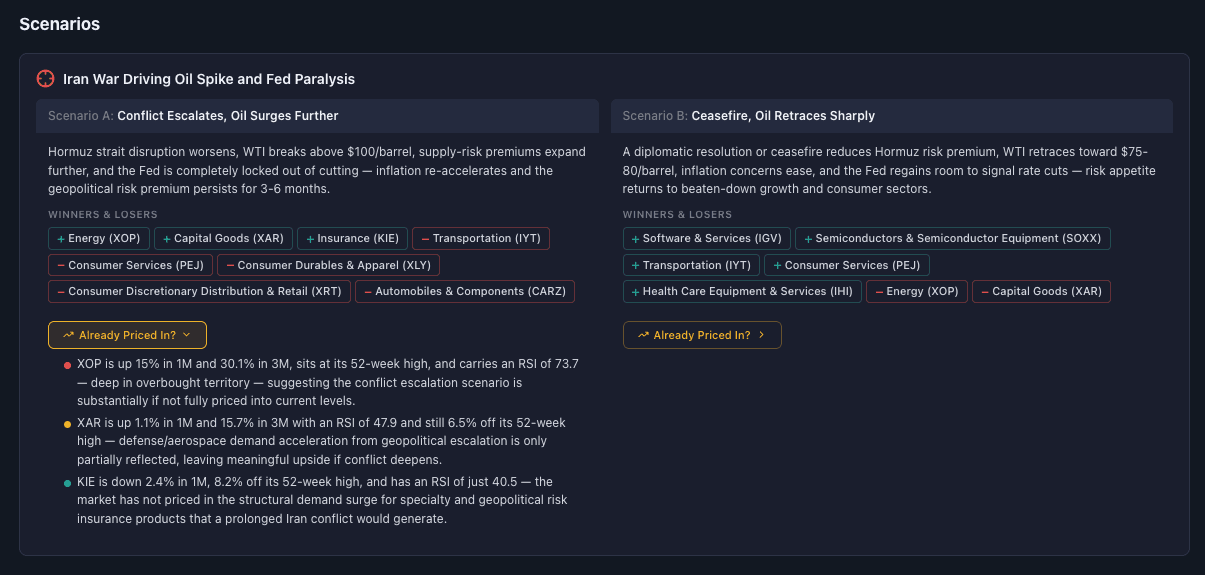
For each theme, the AI generates two contrasting scenarios:
- Scenario A — What happens if the theme plays out as currently expected (e.g., "Rates continue declining through H2 2026")
- Scenario B — What happens under the alternative outcome (e.g., "Inflation reaccelerates, forcing the Fed to pause or reverse cuts")
Each scenario identifies which sectors benefit, which get hurt, and — critically — whether the expected outcome is already priced in. A theme that everyone expects has less value as a signal than one the market hasn't fully discounted.
Stage 2: Sector verdicts
Using the theme analysis from Stage 1 plus all the quantitative data — 1-month returns, percentage from 52-week high, RSI, P/E ratio, PEG ratio, analyst buy percentage, and EPS revision direction — the AI delivers conviction-ranked sector verdicts. Each verdict cites the specific data points that support it, so you can evaluate the reasoning rather than taking the conclusion on faith.
How to read the scenario map
The scenario map appears in the "AI Model" tab on the Opportunity page. Here's how to use it effectively:
- Start with the themes. The 2–3 theme cards at the top tell you what the AI considers the dominant macro forces right now. Each has a title and a brief description. These aren't predictions — they're the macro narratives that are currently driving sector-level capital flows.
- Compare Scenario A vs B. For each theme, two panels show the contrasting outcomes. Look at the "Benefits" and "Hurts" lists to see which sectors win or lose under each scenario. If a sector appears in the "Benefits" column under both scenarios, it has robust positioning regardless of which outcome materialises.
- Check "Already Priced In?" Each scenario includes a toggle showing the AI's assessment of whether the market has already repriced for that outcome. A sector that benefits from Scenario A but is "already priced in" may have less upside than one the market hasn't yet adjusted for.
- Cross-reference with the Opportunity table. After reading the scenarios, scroll up to the Opportunity Score table. Sectors that the scenario analysis identifies as beneficiaries and that show a high Opportunity Score (strong macro + recent dip) are the strongest convergence signals.
Prediction market signals: what the crowd is pricing in
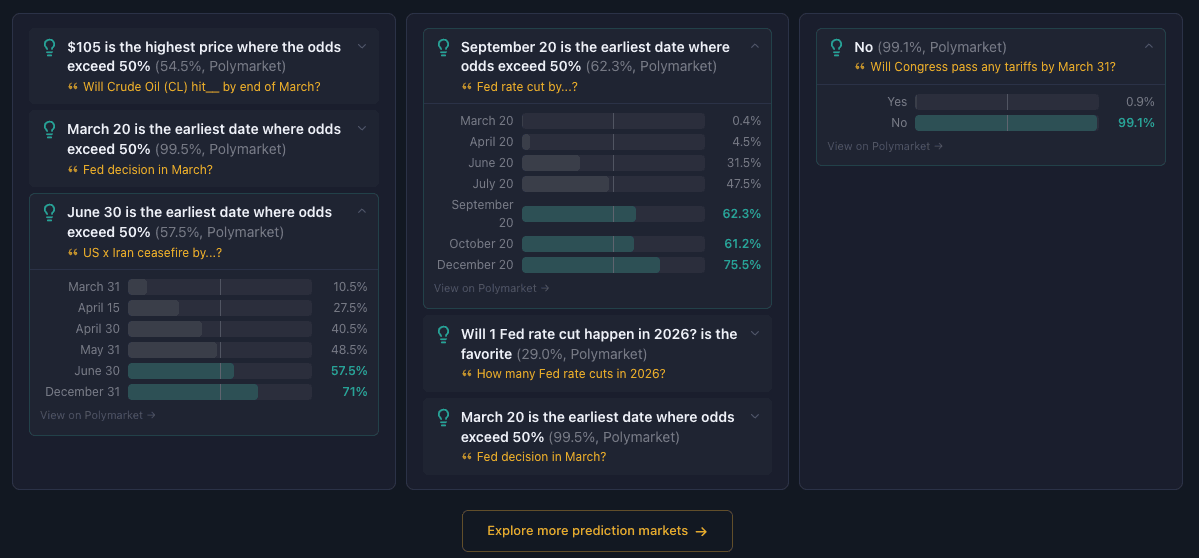
Macro scenarios describe what might happen. Prediction markets tell you what the crowd thinks will happen — in the form of real-money bets on specific outcomes. AlphaDrift scans Polymarket for bets that are relevant to the dominant economic themes identified by the Macro Scenario Lens, then uses AI to select the most informative markets and extract a summary signal from each.
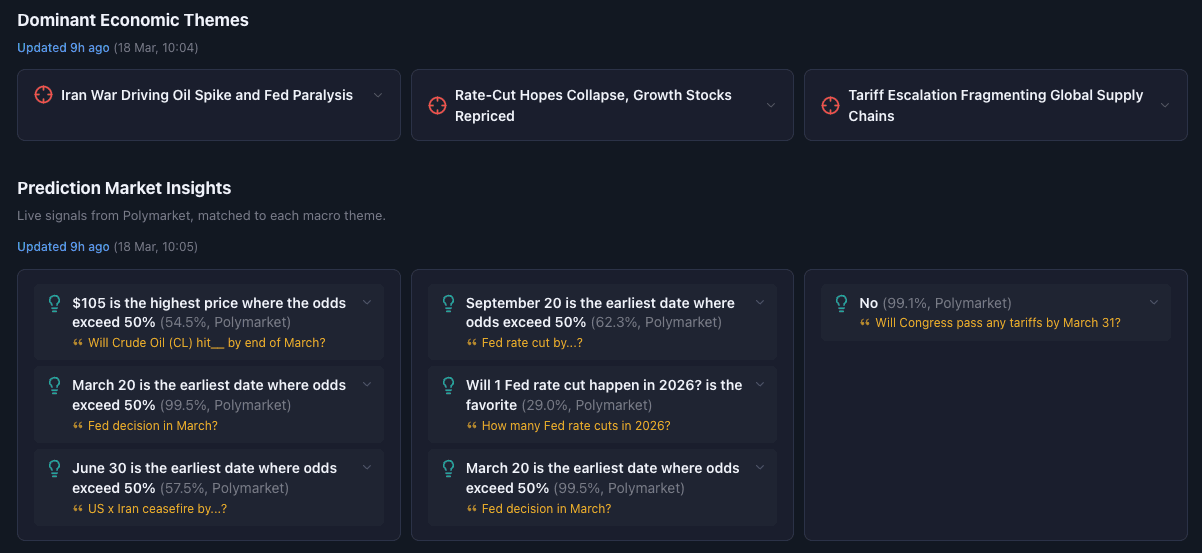
For example, if one of the scenarios is about the timing of the next Fed rate cut, AlphaDrift finds the corresponding Polymarket bets and identifies the tipping point — the earliest date where more than 50% of money says "yes." If another scenario involves oil prices, it finds the highest price threshold where the odds still exceed 50%. These signals are surfaced alongside the scenario cards on the Opportunity page as an additional data point — a crowd-sourced probability check on the AI's macro themes.
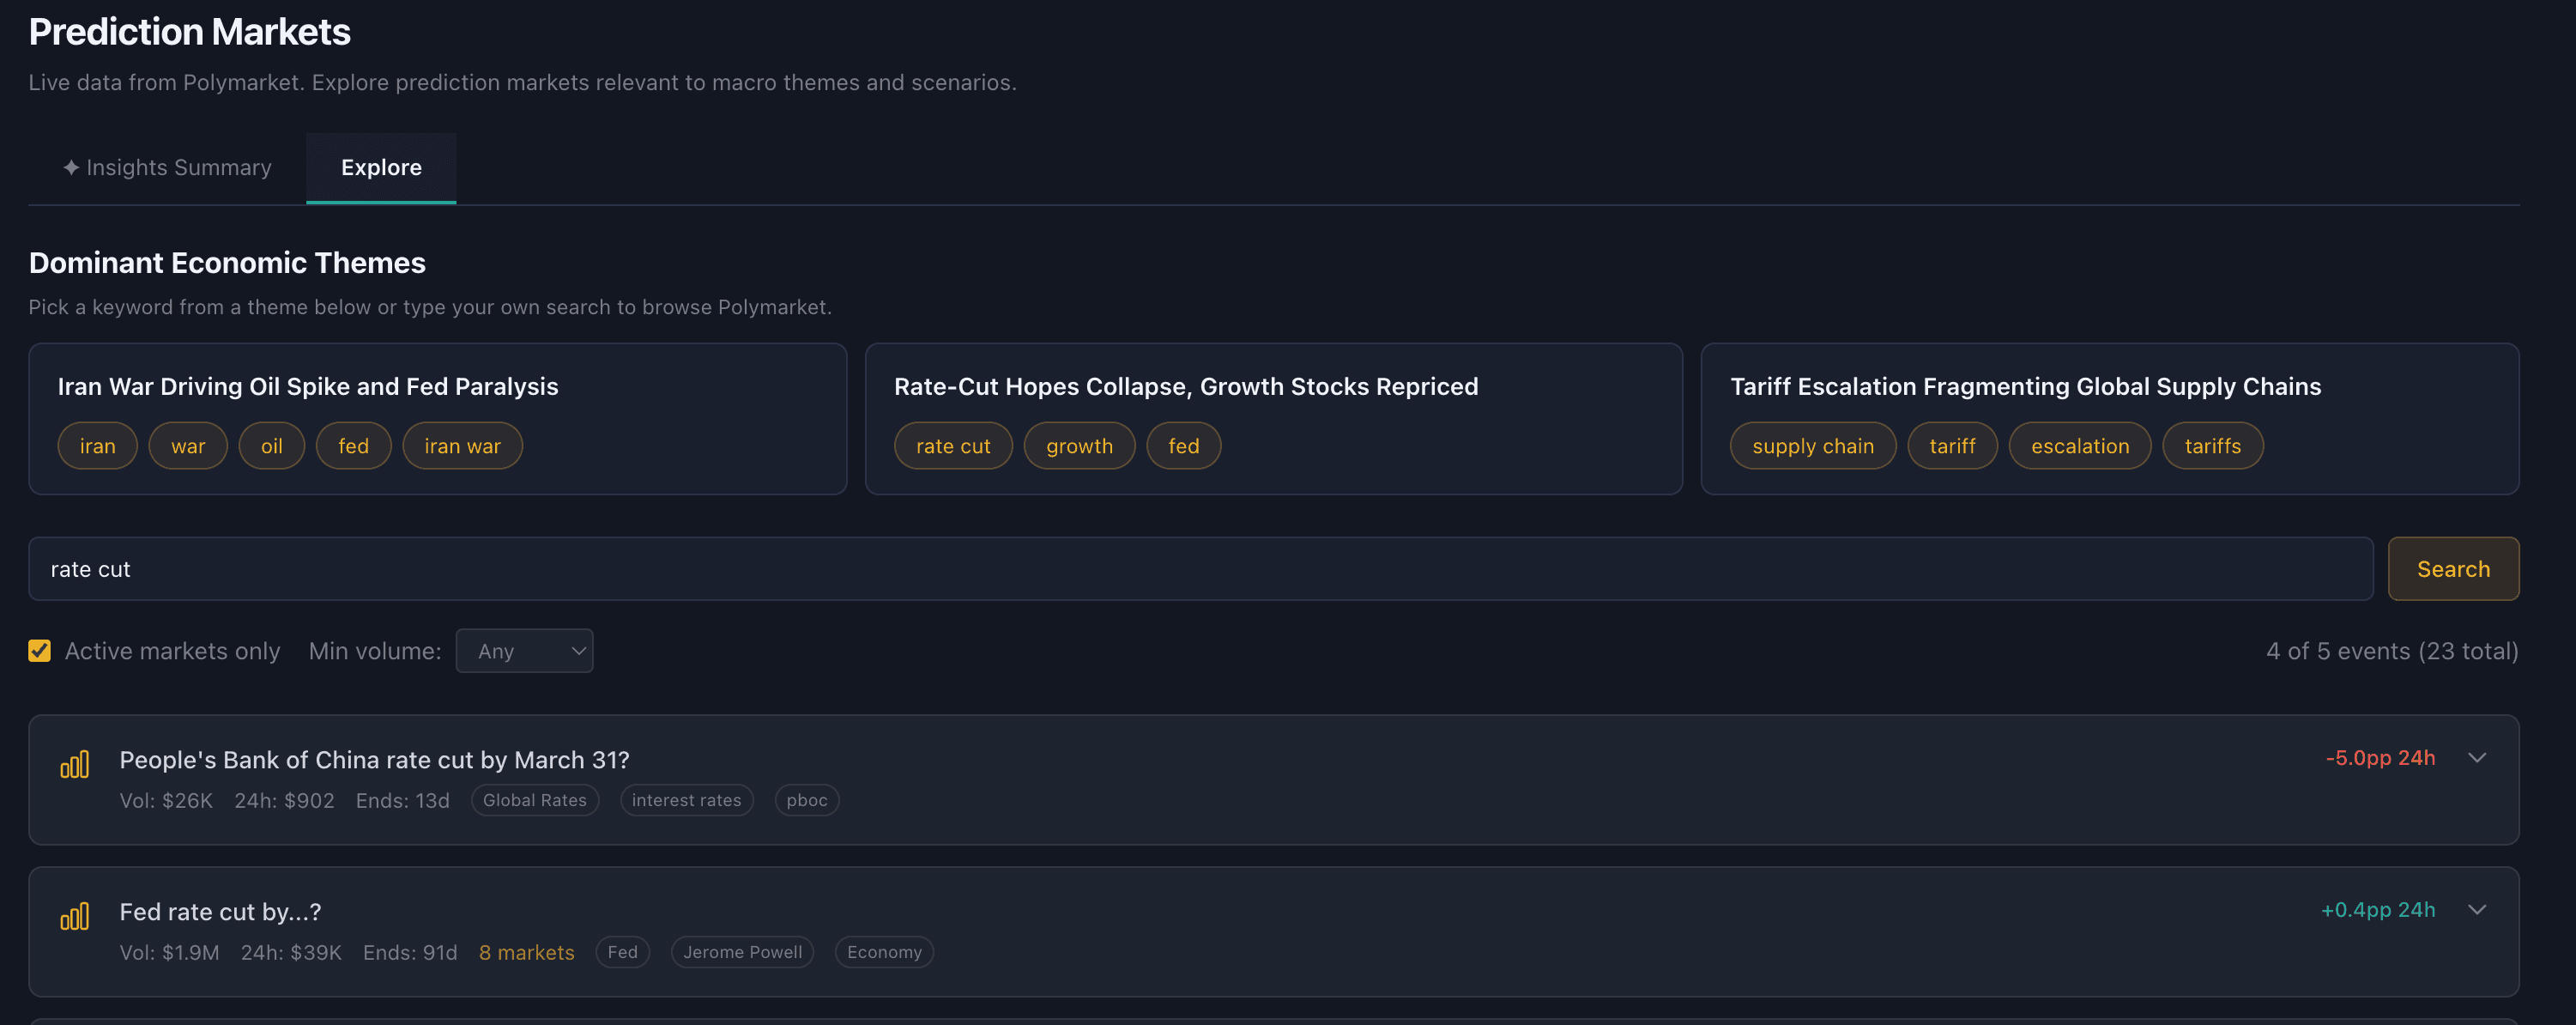
You can also explore the prediction markets manually on the Predictions page, which offers a direct search interface into Polymarket's data. Theme-based pill buttons let you quickly pull up bets related to each macro scenario, with full detail on outcome probabilities, trading volume, and market structure.
Prediction markets reflect crowd consensus, not certainty. A 70% probability means the market believes something is likely — not that it will happen. These signals are most useful as a cross-reference: when the scenario analysis and the prediction markets agree, the signal is stronger. When they diverge, it's worth investigating why.
Buy, caution & avoid: AI-generated sector verdicts
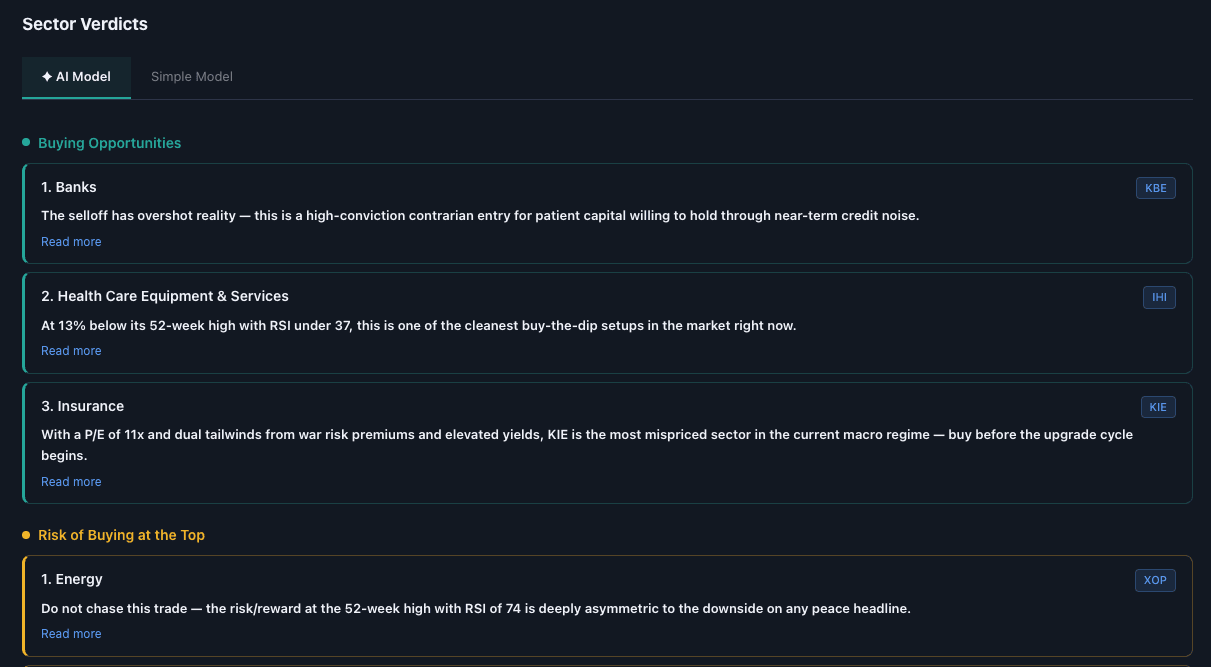
Below the scenario map, the Macro Scenario Lens displays three ranked verdict sections:
- Buying Opportunities (3–5 sectors) — Groups with strong fundamentals plus a recent price pullback. The AI ranks these by conviction, with the top pick having the strongest combination of data support. Each entry names the sector, its primary ETF, and a rationale citing specific metrics — for example: "Semiconductors (SOXX): 1M return −8.2%, RSI 38, analyst buy rate 72%, with forward EPS revisions still positive. The sell-off is sentiment-driven, not fundamental."
- Risk of Buying at the Top (2–4 sectors) — Groups with a valid macro thesis but potentially stretched valuations or momentum. These aren't sell signals — they're flags that the easy gains may have already been captured. Monitor for a pullback before adding exposure.
- Structural Weakness — Avoid (2–3 sectors) — Groups with deteriorating fundamentals, negative EPS revisions, or a macro environment working against them. These sectors may look "cheap" on price alone, but the outlook suggests the decline is structural, not a dip.
Verdicts are analysis, not advice. The buy/caution/avoid labels describe the data pattern the AI has identified — strong-fundamentals-with-dip, stretched-valuations, or structural-decline. They are not recommendations to buy or sell any security. Always conduct your own research before making investment decisions.
What the sector outlook cannot tell you
Macro-based sector analysis has clear limitations that every investor should understand:
- Macro forces operate on long time horizons. FRED indicators like inflation, employment, and industrial production move in multi-month trends. They're useful for a 6–12 month positioning view, not for timing entries or exits over days or weeks.
- Sector-level analysis misses company-level divergences. A sector with strong headwinds can still contain individual companies that outperform. The macro outlook tells you the prevailing wind — some companies can still sail against it.
- AI scenario analysis reflects current data, not clairvoyance. The themes and scenarios Claude generates are derived from the latest economic indicators and news — they reflect the current macro regime, not a prediction of future events. An unexpected policy shift, geopolitical shock, or pandemic-scale event would invalidate any scenario analysis.
- "Already priced in" is inherently uncertain. The AI uses quantitative signals (RSI, returns, valuations) to estimate whether a macro theme is reflected in current prices. This is an educated assessment, not a definitive answer — markets can remain mispriced for extended periods in either direction.
- The outlook refreshes daily. Themes and verdicts can change as new economic data arrives. A sector in the "Buy" bucket today may shift to "Caution" after a strong rally or a change in macro conditions. Check back regularly rather than treating any snapshot as permanent.
AlphaDrift is an informational tool, not a financial adviser. The macro outlook, scenario analysis, and sector verdicts are designed to support your investment research — not to replace professional financial advice. Always consult a qualified financial adviser before making investment decisions.
Frequently asked questions
What economic data does AlphaDrift use for its sector outlook?
AlphaDrift tracks 8 universal economic indicators from the Federal Reserve's FRED database: the federal funds rate, 10-year Treasury yield, yield curve spread (10Y−2Y), WTI crude oil price, University of Michigan consumer sentiment, unemployment rate, industrial production index, and CPI inflation. For specific industry groups, it also pulls targeted data — like semiconductor production for Semiconductors, total vehicle sales for Autos, and commercial bank loans for Banks.
What is the Macro Scenario Lens and how does it work?
The Macro Scenario Lens is a two-stage AI analysis on AlphaDrift's Opportunity page. First, Claude Sonnet (Anthropic's reasoning model) reads all FRED data, market sentiment, and sector scores to identify 2–3 dominant economic themes. For each theme, it maps two contrasting scenarios and identifies which sectors benefit or get hurt. Second, it delivers buy/caution/avoid verdicts citing specific metrics like 1-month returns, RSI, P/E ratios, and EPS revision direction.
How often does the sector outlook update?
The full sector outlook — including FRED data, macro scores, scenario themes, and verdicts — refreshes daily after the US market close (approximately 4:15 PM EST). FRED economic indicators themselves update on varying schedules: employment data is monthly, the CPI is monthly, and some series are weekly. The AI re-evaluates themes and verdicts every day based on the latest available data.
What is sector rotation and how can macro data help?
Sector rotation is the movement of capital between industry sectors as economic conditions change. During rate-cutting cycles, money tends to flow into rate-sensitive sectors like REITs and Utilities. During periods of rising commodity prices, Energy and Materials typically outperform. AlphaDrift's FRED-based analysis tracks these macro forces and maps them to all 25 GICS Industry Groups, helping you identify structural tailwinds and headwinds before they fully show up in price.
How does AlphaDrift use prediction markets?
AlphaDrift scans Polymarket for real-money bets related to the dominant macro themes — such as Fed rate decisions, oil price targets, or inflation outcomes. For each bet, it identifies the tipping point where the crowd assigns more than 50% probability (e.g., "June 2026 is the earliest date where the market prices in a rate cut with >50% odds"). These signals appear alongside the AI scenario cards as a crowd-sourced probability check. You can also explore the raw prediction market data on the Predictions page.
Does AlphaDrift predict which sectors will outperform?
No. AlphaDrift identifies which macro forces are currently at play and which sectors have structural tailwinds or headwinds based on FRED economic data and AI scenario analysis. It does not predict future price movements or guarantee outperformance. Macro analysis is one input in your research process — use it alongside valuation analysis, earnings data, and the Opportunity Score to form your own investment view.