AI stock analysis tool: how AlphaDrift surfaces sector signals
Most AI stock tools pick individual stocks. AlphaDrift is an AI market intelligence dashboard that works at the sector level — scoring 25 industry groups on macro fundamentals, finding where price has diverged from outlook, and surfacing the gap as an investment signal.
- AlphaDrift scores all 25 GICS Industry Groups on a 0–100 macro outlook — completely independent of recent price movements.
- It then compares that outlook to actual price momentum to find sectors where the market may have over- or under-reacted.
- Signals are inputs to your research, not buy/sell instructions. AlphaDrift is a signal tool, not a financial advisor.
What is AI stock analysis?
AI stock analysis uses machine learning and large language models to process financial data — analyst ratings, macro indicators, news sentiment, price movements — and surface patterns that would take a human analyst hours to compile manually.
The appeal is clear: markets generate enormous amounts of data every day, and AI can process it faster and more consistently than any individual investor. But how AI is applied matters far more than the fact that AI is involved at all.
Most AI stock tools focus on individual stock selection — scanning thousands of tickers for technical patterns, momentum signals, or sentiment shifts. Tools like Danelfin, Trade Ideas, and Tickeron all work this way — and they do it well. But they share a common blind spot.
The blind spot in most AI stock tools
Individual stock picking, whether by humans or AI, tends to focus on what a company is doing — earnings surprises, technical chart patterns, social media sentiment. But academic research — notably the Brinson, Hood & Beebower study and subsequent work — suggests that asset allocation and sector-level forces explain a significant share of portfolio return variation. Interest rates, inflation, consumer confidence, industrial production — these macro forces lift or drag entire industry groups, and individual stocks move with them.
This is how institutional fund managers think about allocation. Before they pick a stock, they decide which sectors deserve more or less capital — a process called sector rotation. Most retail investors skip this step entirely. They go straight to stock selection without asking the more fundamental question: is this sector heading in the right direction?
That's the gap AlphaDrift is designed to fill.
How AlphaDrift approaches it differently
AlphaDrift is an AI stock analysis tool and market intelligence dashboard that works at the sector level first, not the individual stock level. It scores all 25 GICS Industry Groups — the global standard for classifying market sectors — on their 6–12 month fundamental outlook.
The critical design principle: the macro score is completely independent of recent price movements. It measures where fundamentals are heading, not where price has been. Price momentum is tracked separately. The interesting signals emerge where these two views diverge — where the market's recent behaviour doesn't match the fundamental outlook.
The core thesis: When a sector's macro outlook is strong but its price has recently dropped, that gap might represent an opportunity. When a sector's outlook is weak but its price has recently surged, that gap might represent a risk. AlphaDrift surfaces these divergences systematically.
The four-layer framework
AlphaDrift organises its analysis into four connected layers, each building on the last. Think of it as zooming in — from the broadest macro view down to your individual holdings.
Layer 1: Macro outlook
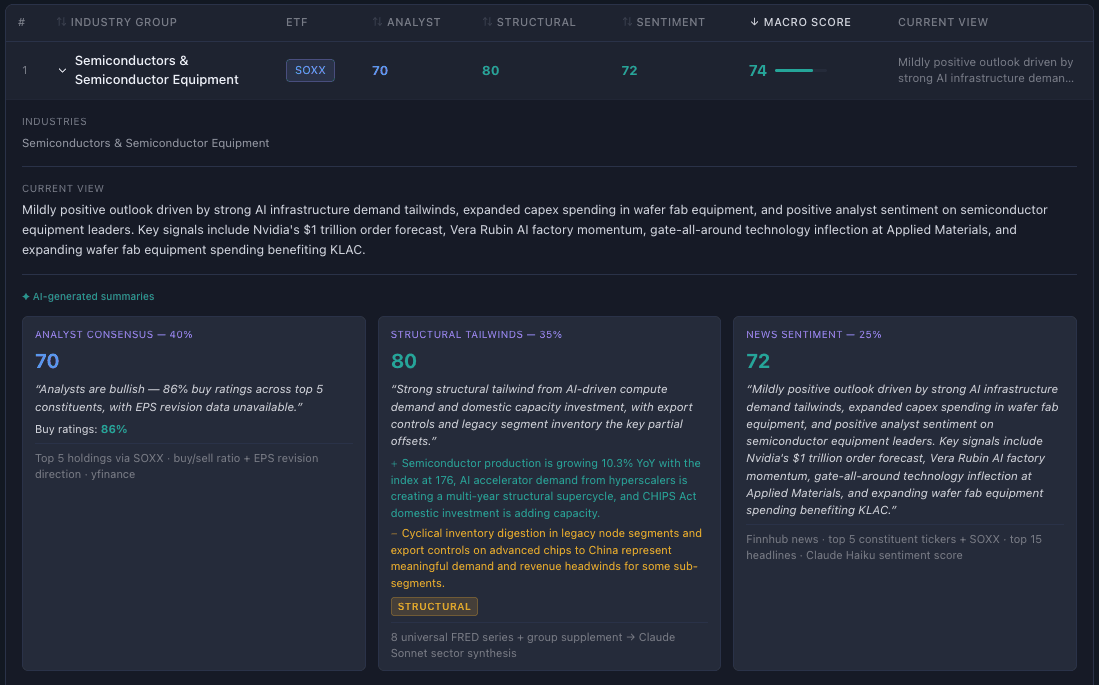
Every industry group gets a 0–100 composite score based on three weighted signals:
- Analyst consensus (40%) — Buy/hold/sell ratings and EPS revision trends from the top 5 companies in each group. Are professional analysts getting more or less bullish?
- Structural tailwinds (35%) — Macro-level forces from real economic data: interest rates, inflation, industrial production, consumer confidence, oil prices, and more. AI reasons about how current macro conditions affect each sector differently.
- Expert sentiment (25%) — Recent news coverage and analyst commentary, scored by AI for its directional signal. Not price commentary — fundamental developments like regulatory changes, capacity announcements, and demand signals.
The result is a forward-looking fundamental grade for each of the 25 industry groups, refreshed daily. See the live Macro Outlook →
Layer 2: What's moving
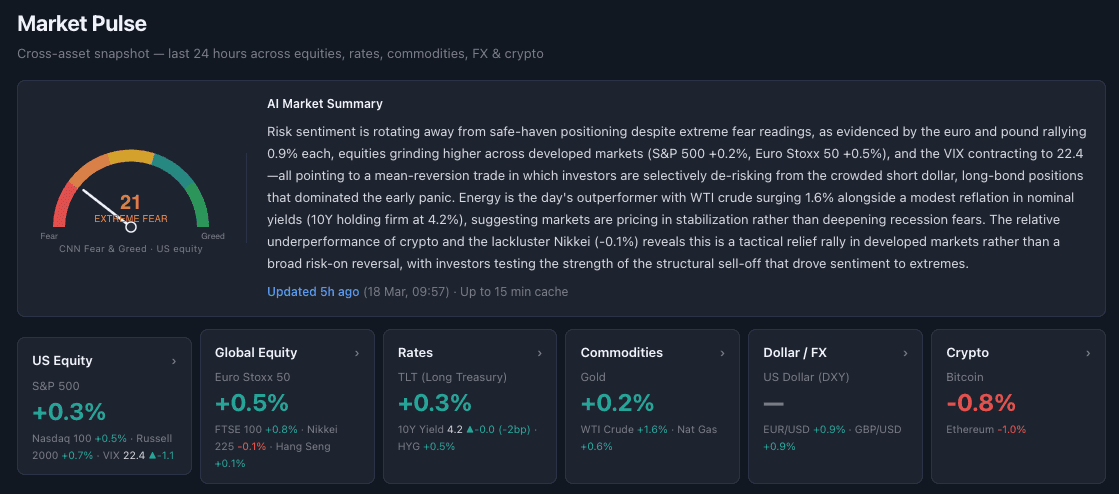
While Layer 1 looks at where fundamentals are heading, Layer 2 looks at where prices are actually going — right now. It tracks price momentum across all 25 industry groups over three timeframes (1-day, 5-day, 30-day) and uses AI to explain why each sector is moving, pulling from recent news headlines to identify the likely catalyst.
Layer 2 also includes a Market Pulse — a cross-asset sentiment snapshot covering US equities, global equities, interest rates, commodities, currencies, and crypto, anchored by the CNN Fear & Greed Index. See What's Moving now →
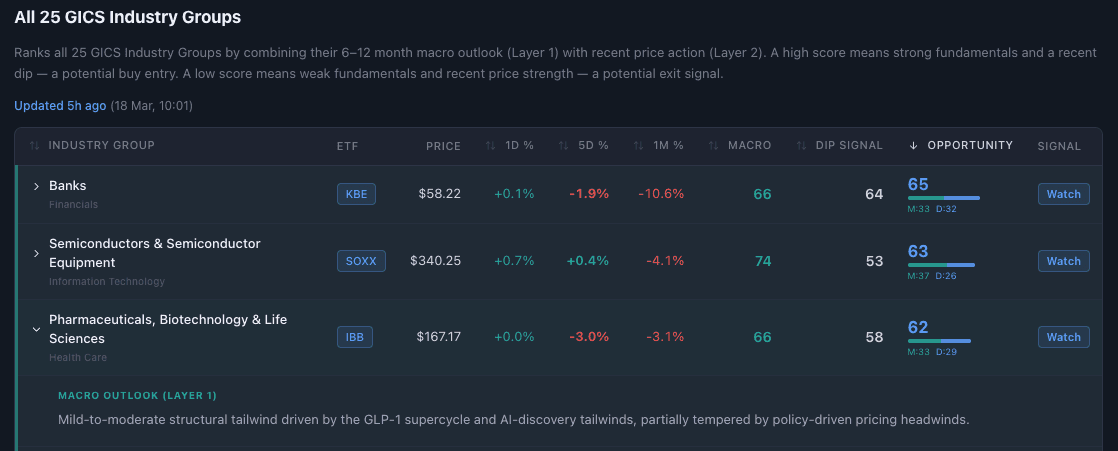
Layer 3: Opportunity signal
This is where it gets interesting. Layer 3 combines the macro outlook (Layer 1) with recent price momentum (Layer 2) into an Opportunity Score per industry group. Sectors where the macro outlook is strong but price has been weak score highest — they represent potential opportunity. Sectors where price has run up but fundamentals are weak score lowest — potential risk.
The top opportunities are highlighted with AI-generated rationale explaining the divergence and the reasoning behind the signal, along with the specific ETF that gives the most targeted exposure to that industry group. See Opportunity Signals →
Layer 4: Your holdings
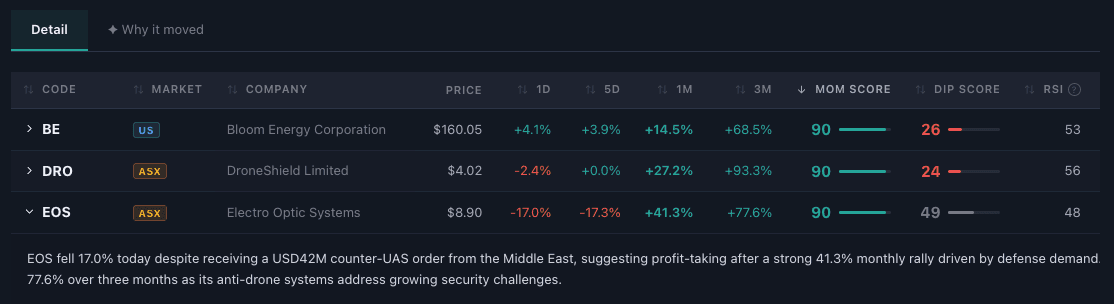
Layer 4 applies the sector-level intelligence to your individual stocks. Each holding is scored on momentum trend, recent dip magnitude, RSI, and valuation — then paired with an AI-generated explanation of why it's moving. The combination helps you quickly spot which positions might deserve your attention. See how holdings signals work →
What powers the signals
Transparency builds trust. Here's exactly where AlphaDrift's data comes from — no black boxes.
- FREDFederal Reserve Economic Data — 8 universal macro indicators (fed funds rate, 10-year yield, CPI, unemployment, consumer sentiment, industrial production, oil prices, yield curve) plus sector-specific supplements for ~10 industry groups.
- FinnhubFinnhub News API — Sector-specific news headlines from the past 14 days, scored by AI for directional sentiment.
- yfinanceYahoo Finance — ETF and stock price data, analyst recommendations, forward EPS estimates, and valuation metrics.
- Claude AIAnthropic's Claude — Large language model used for three tasks: reasoning about how macro conditions affect each sector (Sonnet), scoring news sentiment (Haiku), and generating narrative explanations for signals and price movements (both models).
- PolymarketPrediction Markets — Real-money bets on macro events (rate cuts, inflation outcomes, geopolitical events) via Polymarket. AlphaDrift matches relevant prediction markets to its macro themes and extracts probability signals — for example, the price level where bets imply >50% likelihood, or the most-expected outcome in a range of scenarios. See Prediction Signals →
Every score on AlphaDrift traces back to one or more of these sources. The result is AI fundamental analysis built from real economic data and professional analyst consensus — not social media chatter or technical chart patterns.
How to use AlphaDrift's signals in your investment process
AlphaDrift is a signal tool, not a financial advisor. The signals it generates — sector opportunity scores and insights for individual holdings — are designed to be inputs to your research, not instructions to follow blindly.
Here's how the signals are designed to be used:
- Screening — Use the Macro Outlook to quickly identify which sectors have the strongest and weakest fundamental outlook, before diving into individual stock research.
- Divergence context — Use the Opportunity Score to see whether a sector you're researching has recently pulled back despite a strong outlook, or recently surged despite a weak one. The divergence itself is the signal — what you do with it is your call.
- Portfolio review — Use the Holdings signals to flag positions that might deserve attention — either because the macro backdrop has shifted or because the stock's price behaviour has diverged from its sector.
- Catalyst identification — Use the AI movement explanations to quickly understand why a sector or stock is moving, without manually scanning news feeds.
What AlphaDrift doesn't do: It doesn't account for your personal financial situation, tax implications, portfolio concentration, or risk tolerance. It doesn't know your investment timeline. It doesn't replace a qualified financial advisor. The signals are one lens among many that a thoughtful investor might use.
Frequently asked questions
Can AI reliably pick stocks?
AI can process vast amounts of financial data faster and more consistently than any individual, and it can surface patterns humans might miss. But no AI — or human — can predict the market with certainty. AlphaDrift doesn't try to pick individual winning stocks. Instead, it identifies sectors where the fundamental outlook has diverged from recent price behaviour, giving you a more informed starting point for your own research.
How is AlphaDrift different from other AI stock tools?
Most AI stock tools — Danelfin, Trade Ideas, Tickeron, AltIndex — focus on scoring or screening individual stocks using technical patterns and short-term signals. AlphaDrift works at the sector level, scoring all 25 GICS Industry Groups on their macro fundamental outlook independently of price. This top-down approach is closer to how institutional fund managers think about capital allocation, and it captures sector-level forces that individual stock screeners often miss.
What GICS Industry Groups does AlphaDrift track?
AlphaDrift scores all 25 GICS Industry Groups as defined by the MSCI Global Industry Classification Standard. These include Energy, Semiconductors, Software & Services, Banks, Pharmaceuticals, Utilities, Real Estate, and 18 others. Each group has a designated primary ETF for targeted exposure. See the full list on the Reference page.
How does AlphaDrift use Claude AI?
AlphaDrift uses Anthropic's Claude in two ways. Claude Sonnet (the more capable model) reasons about how current macro conditions — interest rates, inflation, industrial production — affect each sector's structural outlook. Claude Haiku (the faster model) scores news sentiment and generates concise explanations for price movements. Both models produce structured output that feeds directly into the scoring pipeline — they're not generating general investment advice.
How often are scores updated?
Macro outlook scores (Layer 1), the Opportunity Score (Layer 3), and Holdings signals (Layer 4) all refresh daily after the US market close. Price momentum data (Layer 2) refreshes an additional two times during ASX market hours (around 10:30 AM and 4:15 PM AEST), on weekdays. Each page shows when it was last updated so you always know how fresh the data is.
Is AlphaDrift free?
AlphaDrift is currently a free personal project. Future plans may include premium features with user accounts and personalised holdings analysis. The core sector intelligence dashboard is intended to remain accessible.