Buy, sell & hold signals: how to read what your holdings are telling you
AlphaDrift scores every holding in your portfolio on momentum, dip magnitude, RSI, and valuation — then uses AI to explain why each one is moving. Here's how to read these buy, sell and hold signals and use them in your investment research.
- Each holding gets a Momentum Score (is the trend up or down?) and a Dip Score (has it recently pulled back?) — two complementary views of price behaviour.
- These scores are combined with RSI, valuation metrics, and AI-generated movement explanations grounded in recent news.
- The signals are diagnostic — they flag holdings that might deserve your attention, not instructions to buy or sell.
The portfolio attention problem
Most investors check their portfolio when something dramatic happens — a big red day, a headline about a company they own, or a quarterly earnings surprise. The rest of the time, holdings sit in a brokerage app showing a dollar gain or loss and not much else.
The problem isn't a lack of data. Yahoo Finance, Google Finance, and every brokerage platform will show you price charts, P/E ratios, and analyst ratings for individual stocks. The problem is attention allocation — knowing which holdings deserve your time right now, and which are fine to leave alone.
That's what AlphaDrift's holdings signals are designed to solve. Instead of reviewing every position manually, the system scores each holding on multiple dimensions and surfaces the ones where something interesting is happening — a sharp dip on a stock with strong sector fundamentals, a momentum breakdown in a holding you haven't checked in months, or an overbought RSI reading after a rapid run-up.
How AlphaDrift scores your holdings
Every holding on your watchlist receives four layers of scoring, refreshed daily after the US market close:
- Momentum Score (0–100) — Is the overall trend up, down, or flat?
- Dip Score (0–100) — Has it recently pulled back? How sharply?
- RSI (14-day) — Is it overbought or oversold on a technical basis?
- Valuation — Forward P/E and PEG ratio for stocks; trailing P/E for ETFs.
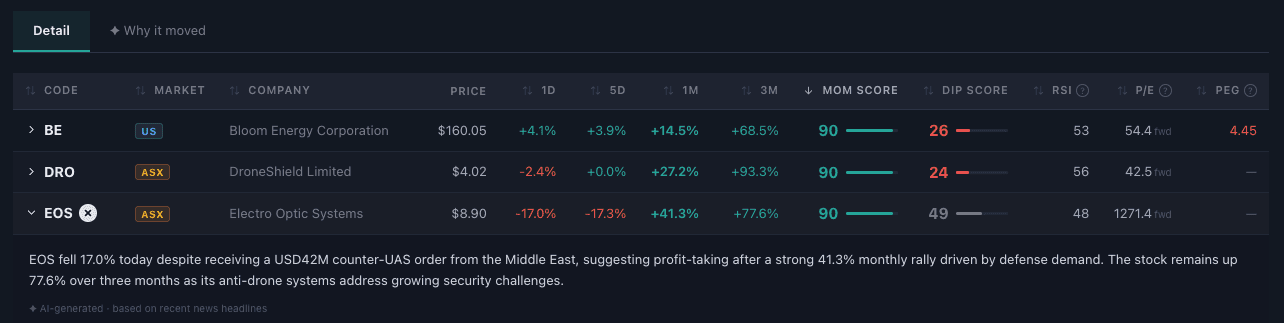
On top of these quantitative signals, each holding also gets an AI-generated explanation of why it's moving, grounded in recent news headlines. The combination of "what's happening" (scores) and "why it's happening" (AI explanation) gives you a fast, multi-dimensional read on every position.
Momentum score: is the trend your friend?
The Momentum Score measures whether a holding has been rising or falling, and how strongly. It blends price returns across four timeframes with different weights:
- 1-day return (15% weight) — Today's move. Captures breaking news reactions but low weight prevents single-day noise from dominating.
- 5-day return (20% weight) — The past week. Picks up short-term sentiment shifts and earnings reactions.
- 1-month return (40% weight) — The heaviest weight. This is the sweet spot: recent enough to reflect current conditions, long enough to filter out daily noise.
- 3-month return (25% weight) — Medium-term direction. Captures sustained trends and structural moves.
The weighted returns are scaled to a 0–100 score centred at 50:
- 70–90: Strong uptrend — consistent gains across timeframes.
- 55–69: Rising — positive momentum building.
- 45–54: Flat — no clear directional signal.
- 30–44: Falling — losses outweighing gains.
- 10–29: Strong downtrend — sustained declines.
A momentum score tells you the direction and strength of the trend. It doesn't tell you why it's happening or whether the trend will continue — that's where the other signals come in.
Dip score: spotting pullbacks worth watching
The Dip Score answers a different question: has this holding recently pulled back, and by how much? A higher score means a bigger recent dip.
The formula uses three timeframes with different weights:
- 1-day return (20% weight) — Catches sudden drops from breaking news or panic selling.
- 5-day return (50% weight) — The heaviest weight. A week-long pullback is the sweet spot — after a sudden sell-off or an earnings miss that hasn't fully played out.
- 1-month return (30% weight) — Captures broader pullbacks, but deliberately excludes 3-month data. A stock that's been falling for three months isn't "dipping" — it may be repricing to new fundamentals.
The score is inverted: negative returns produce a high dip score. The weighted return is normalised so that a −15% pullback maps to a score of 100, flat maps to 50, and a +15% gain maps to 0. A reading of 70+ means a significant recent pullback.
Why the dip score matters: Not all dips are opportunities — some reflect genuine deterioration. But a high dip score on a holding whose sector has a strong macro outlook (scored independently in Layer 1) is exactly the kind of divergence that might warrant closer research. The dip score surfaces these moments; you decide whether the dip is a buying opportunity or a warning sign.
RSI & valuation context
Momentum and dip scores tell you about recent price behaviour. AlphaDrift adds two more signals to give you broader context:
RSI (14-day relative strength index)
RSI is a standard technical indicator that measures the speed and magnitude of recent price changes on a 0–100 scale. AlphaDrift uses Wilder's 14-day RSI, the industry standard:
- Above 70: Overbought — the stock may have risen too fast and could be due for a pullback.
- 30–70: Neutral range — normal trading conditions.
- Below 30: Oversold — the stock may have fallen too hard and could be due for a bounce.
RSI is colour-coded in the holdings table: red for overbought, green for oversold, neutral otherwise. It's a cross-check, not a standalone signal — an overbought RSI on a stock with strong momentum might simply confirm a strong trend rather than signalling a reversal.
Valuation metrics
For individual stocks, AlphaDrift shows the forward P/E ratio (price relative to expected future earnings) and PEG ratio (P/E adjusted for earnings growth). For ETFs, which lack forward earnings data, it falls back to trailing P/E (price relative to actual past-12-month earnings).
PEG is colour-coded in the holdings table using standard thresholds:
- Under 1.0 (green) — Growth at a reasonable price. The stock's valuation is low relative to its earnings growth rate.
- 1.0–2.0 (neutral) — Fairly valued for its growth. Neither cheap nor expensive.
- Over 2.0 (red) — Paying a premium for growth. The market is pricing in high expectations that need to be met.
Valuation data comes from Yahoo Finance. These numbers add a fundamentals lens: a stock with high momentum but an extremely elevated P/E might be pricing in a lot of optimism. A stock with low momentum but a modest PEG might be undervalued relative to its growth rate. Neither conclusion is automatic — that's your judgement call.
AI-powered movement explanations
Numbers tell you what is happening. The AI movement explanation tells you why.
For each holding, AlphaDrift gathers recent news headlines from multiple sources — Finnhub, Yahoo Finance, and Google News — and uses Anthropic's Claude AI (Haiku model) to generate a 1–2 sentence explanation of the likely catalyst behind recent price action.
These explanations are grounded in actual news, not general commentary. If a semiconductor stock dropped 4% after an export control announcement, the AI explanation will reference that event specifically — not just say "the stock fell due to market conditions."
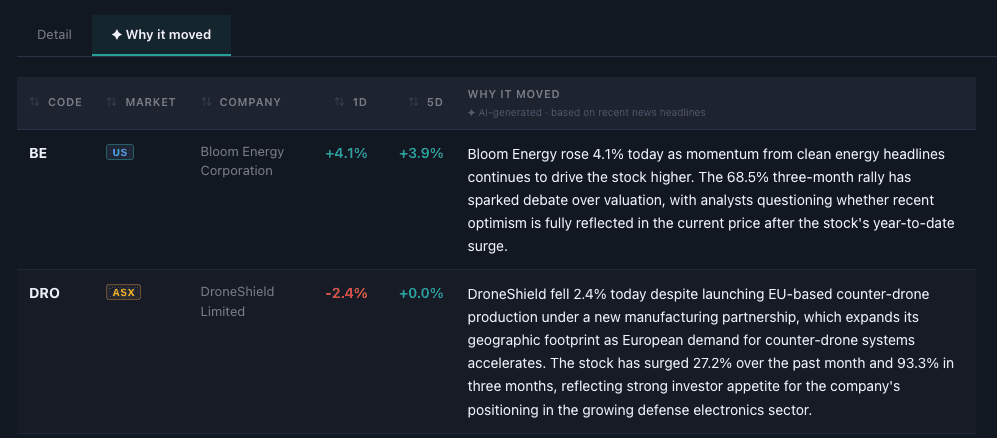
The holdings table includes a dedicated "Why it moved" view that shows the AI explanation for every holding alongside its 1-day and 5-day returns, so you can quickly scan for the holdings where the catalyst matters most to your thesis. Learn how the AI pipeline works →
Momentum vs fundamentals: reading the signals together
Each signal in isolation tells a partial story. The value is in reading them together — and combining them with the sector-level intelligence from AlphaDrift's Macro Outlook:
- High momentum + high dip score: Unusual combination — a stock that's been trending up but just pulled back sharply. Could signal a potential entry point if the dip is driven by temporary news rather than a structural shift.
- Low momentum + high dip score: A stock in a sustained decline that just accelerated downward. The dip might not be an opportunity — it could be the market catching up to deteriorating fundamentals.
- High momentum + low dip score: A stock that's consistently rising with no recent pullback. Momentum is strong, but a high RSI here might suggest it's extended.
- Low momentum + low dip score: A stock drifting without conviction in either direction. Not much to act on — check back later.
Layer these readings against the holding's sector. If the Opportunity Signal for that sector shows a strong macro outlook, a dip on an individual holding within that sector is more interesting than the same dip in a sector with weak fundamentals. You can also factor in broader market sentiment — AlphaDrift tracks the CNN Fear & Greed Index on the What's Moving page, which can help you gauge whether a dip is happening in a fearful market (where dips may be overdone) or a greedy one (where more downside may follow).
How to use the signals on your holdings in your investment process
These signals are designed to be inputs to your research, not trading instructions. Here's how they fit into a thoughtful investment process:
- Weekly review — Sort by momentum score to see which holdings are trending strongest and weakest. Focus your research time on the outliers — the ones at the extremes.
- Dip scanning — Sort by dip score to find holdings that have recently pulled back. Cross-reference with sector outlook and the AI movement explanation to understand whether the dip is noise or signal.
- Overbought/oversold check — Use RSI as a cross-check when momentum is extreme. An overbought stock doesn't mean "sell" — but it might mean "don't add more right now."
- Catalyst review — Read the AI movement explanations to quickly understand why your holdings moved, without manually scanning news feeds for each one.
What these signals don't do: They don't account for your cost basis, tax situation, portfolio concentration, or risk tolerance. They don't know whether you're building a position or trimming one. They don't replace your own research or a qualified financial advisor. They're one lens — a useful one, but one among many.
Frequently asked questions
How does AlphaDrift score individual stock holdings?
Each holding receives four layers of scoring: a Momentum Score (0–100, blending returns across 1-day, 5-day, 1-month, and 3-month timeframes), a Dip Score (0–100, measuring recent pullback magnitude over 1-day, 5-day, and 1-month only), a 14-day RSI reading, and valuation metrics (forward P/E and PEG ratio for stocks, trailing P/E for ETFs). These are combined with an AI-generated explanation of why each holding is moving, grounded in recent news headlines.
How does AlphaDrift calculate momentum score?
The Momentum Score blends price returns across four timeframes: 1-day (15% weight), 5-day (20%), 1-month (40%), and 3-month (25%). The weighted return is scaled to a 0–100 score centred at 50. Above 70 indicates a strong uptrend; below 30 signals a strong downtrend.
What is a dip score and how is it different from momentum?
The Dip Score measures how much a holding has recently pulled back — a higher score means a bigger dip. Unlike momentum, it only uses 1-day, 5-day, and 1-month returns (no 3-month data), which filters out sustained downtrends and focuses on short-term pullbacks that might signal a potential entry point worth researching.
Should I follow stock buy/sell signals blindly?
No. AlphaDrift's signals are diagnostic tools designed to flag holdings that might deserve your attention — not instructions to trade. A high momentum score doesn't mean "buy more", and a low one doesn't mean "sell now." Use the signals alongside your own research, risk tolerance, and investment goals.
How often are holdings signals updated?
Price data and scoring metrics refresh daily after the US market close. AI movement explanations — which identify likely news catalysts for each holding's price action — can be refreshed independently and update throughout the day. Each holding shows when its data was last updated.